US household water bills rise faster than inflation
Analysis finds average annual costs increased 62% over a decade, outpacing income growth.
AI-assisted coverage comparison, editor-supervised · How this was made
US household water bills rise faster than inflation
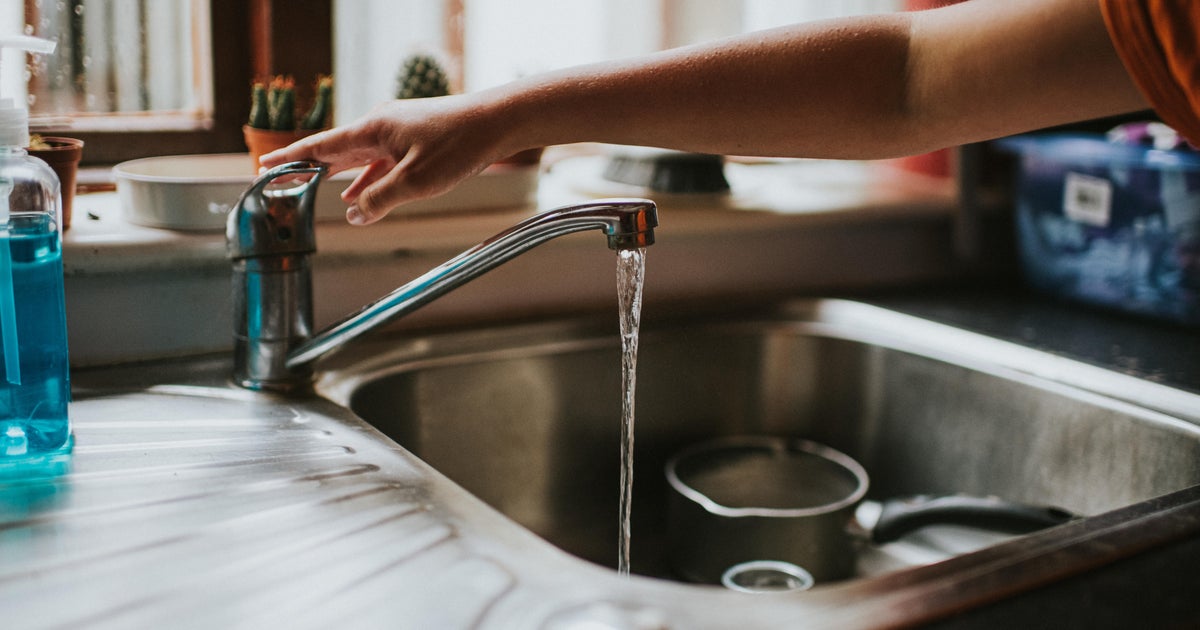
Photograph: CBS News (embedded from source)
What this story says
- Household water bills are increasing faster than inflation and income, a new analysis found.
- Average annual water costs for US households reached $531 in 2025.
- Drinking water bills rose 62% between 2015 and 2025, according to the report.
- The analysis attributes rising costs to corporate control of water systems, climate change, and infrastructure disinvestment.
Who covered it
Percentages are shares of the 38 outlets carrying a published leaning rating. 8 of the 46 outlets we know ran this story carry no rating and are not counted in them. Coverage measured .
Trust
42/100
Craft
57/100
Hype
41/100
46 sources · methodology
Thin on the right so far
Only 3 of the 38 outlets with a published leaning rating that ran this story are rated right.
This story is still being watched, so it is a count and not yet a finding. Coverage keeps arriving for hours after an event, and a side that has published nothing this morning may publish by tonight. If it is still true when we stop checking, we will say so plainly.
Household water bills in the United States are rising at a rate that outpaces both inflation and income growth, according to a new analysis. The study, conducted by the environmental advocacy nonprofit Food and Water Watch, examined water bill data from the 500 largest community water providers nationwide. These providers collectively serve approximately 155 million people.
Between 2015 and 2025, average annual household drinking water bills increased by 62%. By 2025, Americans paid an average of $531 per year for household water. The report attributes these escalating costs to several factors, including corporate control of water systems, the impacts of climate change, and federal disinvestment in water infrastructure.
Coverage comparison
Omissions
None of the right-rated reports mentioned the analysis by Food and Water Watch or the specific reasons cited for the increase in water bills, such as corporate control, climate change, or federal disinvestment in infrastructure.
Still developing. We have re-checked which outlets are covering this 6 times, most recently on 8 Oct 2026, 00:15, and will add the sides that appear.
How each side covered it
Our own reading of the reporting listed below, written from the outlets’ articles rather than quoted from them. The reasoning is set out on our methodology page.
Left
23 rated outlets
- Left-rated reports led with the finding that household water bills are increasing faster than inflation and income. Multiple outlets highlighted that the analysis was conducted by the nonprofit Food and Water Watch, which examined data from the 500 largest community water providers. Several reports also noted that these systems serve 155 million people.
Centre
12 rated outlets
- Centre-rated reports focused on the percentage increase in water bills over the past decade. They stated that Americans are paying 60% or 62% more for drinking water than they did ten years prior. Some reports also mentioned that the average annual cost for household water reached $531 in 2025.
Right
3 rated outlets
- Both right‑rated digests led on the magnitude of water‑rate increases, noting a 62 percent rise over the past ten years. They each highlighted that the increase outpaced grocery price growth and overall inflation, framing the trend as a rapid escalation in household water costs.
- The digests attributed the data to a new analysis released by Food & Water Watch, a nonprofit environmental advocacy group. They reported that Mary Grant, identified as the water‑policy director for the group, described the situation as a quiet emergency, providing a spokesperson’s perspective on the rising bills.
- Neither digest supplied a specific dollar amount for the average household water bill or a projected cost increase for the coming year. As a result, the reports omitted any concrete cost estimate that would illustrate the financial impact on individual families beyond the percentage rise.
Questions about this coverage
- How did the left and right cover US household water bills rise faster than inflation?
- Of the 38 outlets on this story carrying a published leaning rating, 61% are rated left, 31% are rated centre, 8% are rated right. Those percentages are shares of the rated outlets, not of every outlet that ran it, which was 46. The sections above set out what each side emphasised, in its own terms.
- Is US household water bills rise faster than inflation left or right?
- Neither side dominates it. Of the 38 rated outlets on this story, 61% are rated left, 31% are rated centre, 8% are rated right, and no side holds the 70% this site would want before calling a field one-sided. A story is not left or right in any case; the outlets that carried it are what carry ratings.
- Is the coverage of US household water bills rise faster than inflation biased?
- US household water bills rise faster than inflation is one event reported by 46 outlets, and this page does not rate the story as biased or unbiased. What it publishes is the spread: which outlets ran it, where named rating organisations place each of them on the spectrum, and what each side chose to lead with. A leaning rating describes an outlet's record over time, not this article, and the two should not be run together.
- Which side is not reporting US household water bills rise faster than inflation?
- When we first saw this story, outlets rated right had barely covered it. Coverage accretes for hours after an event, so that is where to look rather than a verdict — the split above is the current count, and it is the one to read.
- Which outlets covered US household water bills rise faster than inflation?
- 46 that we know of, every one of them listed further up this page with a link to its own report and to what we hold on the publisher. Nothing here is a summary of somebody else's summary: the outlets are named so the original reporting can be read.
- How much have US household water bills increased?
- Household water bills have increased by an average of 62% between 2015 and 2025. This rise outpaced inflation, grocery prices, and household incomes during the same period.
- What is the average annual cost of water for US households?
- In 2025, Americans paid an average of $531 per year for household water. This figure represents a significant increase compared to previous years.
- What factors are contributing to the rise in water bills?
- The analysis points to corporate control of water systems, the effects of climate change, and a lack of federal investment in water infrastructure as primary drivers of increased water costs.
Read it at the source
46 outlets, grouped by the leaning a published rating gives them. Every headline links to the original; an underlined outlet name opens our profile of that publisher.
Left
23- Americans’ water bills are growing faster than groceries, overall inflation (opens Missouri Independent in a new tab)
Missouri Independent — is Missouri Independent biased? Our profile of this outlet
- Americans’ water bills are growing faster than groceries, overall inflation (opens Beckley Register-Herald in a new tab)
Beckley Register-Herald — is Beckley Register-Herald biased? Our profile of this outlet
- Americans’ water bills are growing faster than groceries, overall inflation (opens Nebraska Examiner in a new tab)
Nebraska Examiner — is Nebraska Examiner biased? Our profile of this outlet
- Americans’ water bills are growing faster than groceries, overall inflation (opens Idaho Capital Sun in a new tab)
Idaho Capital Sun — is Idaho Capital Sun biased? Our profile of this outlet
- Americans’ water bills are growing faster than groceries, overall inflation • West Virginia Watch (opens westvirginiawatch.com in a new tab)
westvirginiawatch.com — is westvirginiawatch.com biased? Our profile of this outlet
- Americans’ water bills are growing faster than groceries, overall inflation (opens arkansasadvocate.com in a new tab)
arkansasadvocate.com — is arkansasadvocate.com biased? Our profile of this outlet
- Americans’ water bills are growing faster than groceries, overall inflation (opens Indiana Capital Chronicle in a new tab)
Indiana Capital Chronicle — is Indiana Capital Chronicle biased? Our profile of this outlet
- Americans’ water bills are growing faster than groceries, overall inflation (opens Pennsylvania Capital-Star in a new tab)
Pennsylvania Capital-Star — is Pennsylvania Capital-Star biased? Our profile of this outlet
Show 15 more
- Americans’ water bills are growing faster than groceries, overall inflation (opens Ohio Capital Journal in a new tab)
Ohio Capital Journal — is Ohio Capital Journal biased? Our profile of this outlet
- Americans’ water bills are growing faster than groceries, overall inflation (opens tiffinohio.net in a new tab)
tiffinohio.net — is tiffinohio.net biased? Our profile of this outlet
- Americans’ water bills are growing faster than groceries, overall inflation • Rhode Island Current (opens rhodeislandcurrent.com in a new tab)
rhodeislandcurrent.com — is rhodeislandcurrent.com biased? Our profile of this outlet
- Americans’ water bills are growing faster than groceries, overall inflation (opens New Jersey Monitor in a new tab)
New Jersey Monitor — is New Jersey Monitor biased? Our profile of this outlet
- Americans’ water bills are growing faster than groceries, overall inflation (opens Minnesota Reformer in a new tab)
Minnesota Reformer — is Minnesota Reformer biased? Our profile of this outlet
- Americans’ water bills are growing faster than groceries, overall inflation (opens Source New Mexico in a new tab)
Source New Mexico — is Source New Mexico biased? Our profile of this outlet
- US Water Bills Surged 62% in 10 Years. A New Map Reveals Where Americans Pay the Most (opens Gizmodo in a new tab)
- Americans’ water bills are growing faster than groceries, overall inflation (opens alabamareflector.com in a new tab)
alabamareflector.com — is alabamareflector.com biased? Our profile of this outlet
- Americans’ water bills are growing faster than groceries, overall inflation (opens Michigan Advance in a new tab)
Michigan Advance — is Michigan Advance biased? Our profile of this outlet
- Americans’ water bills are growing faster than groceries, overall inflation (opens Louisiana Illuminator in a new tab)
Louisiana Illuminator — is Louisiana Illuminator biased? Our profile of this outlet
- Report: 62% Spike in Water Bills Outspaces Incomes, Inflation (opens Newser in a new tab)
- Water Bills Surged More Than Other Costs in US Homes Over a Decade (opens Truthout in a new tab)
- Water Bills Surged More Than Other Costs in US Homes Over 10 Years, a ‘Striking’ New Report Shows (opens Inside Climate News in a new tab)
Inside Climate News — is Inside Climate News biased? Our profile of this outlet
- Your Tap Water Could Have A 67 Percent Markup (opens The Lever in a new tab)
- Americans’ water bills are growing faster than groceries, overall inflation (opens Stateline in a new tab)
Centre
12- Americans are paying 62% more for water than a decade ago. Here's where costs have risen the most. (opens CBS News in a new tab)
- Americans are paying 60% more for water than they did a decade ago (opens Lex18 NBC in a new tab)
- Americans are paying 60% more for water than they did a decade ago (opens WTVR in a new tab)
- Americans are paying 60% more for water than they did a decade ago (opens KZTV in a new tab)
- Americans are paying 60% more for water than they did a decade ago (opens KJRH in a new tab)
- Americans are paying 60% more for water than they did a decade ago (opens KXLH.com in a new tab)
- Americans are paying 60% more for water than they did a decade ago (opens KTVQ in a new tab)
- Americans are paying 60% more for water than they did a decade ago (opens KTVH in a new tab)
Show 4 more
- Americans are paying 60% more for water than they did a decade ago (opens KPAX in a new tab)
- Americans are paying 60% more for water than they did a decade ago (opens KBZK in a new tab)
- Water bills jump 62% in a decade, outpacing inflation, new study says (opens WAGA in a new tab)
- Roundup: Surging water bills / Dyed diesel fuel / US trade gap widens (opens Business Report in a new tab)
Business Report — is Business Report biased? Our profile of this outlet
Right
3- Americans drowning in water bills as rates skyrocket across country (opens Bizpac Review in a new tab)
Bizpac Review — is Bizpac Review biased? Our profile of this outlet
- The Other Affordability Crisis Quietly Drowning Americans (opens The Daily Caller in a new tab)
The Daily Caller — is The Daily Caller biased? Our profile of this outletOpinion
- Americans drowning in water bills as rates skyrocket across country - The Daily Bo Snerdley (opens thedailybs.com in a new tab)
thedailybs.com — is thedailybs.com biased? Our profile of this outlet
Not rated
8- The Other Affordability Crisis Quietly Drowning Americans (opens Restoring Liberty in a new tab)
Restoring Liberty — is Restoring Liberty biased? Our profile of this outletOpinion
- US households pay 62% more for water than they did a decade ago, study finds (opens BizToc in a new tab)
- Water industry responds to report that water bills rose 62% over decade (opens waterworld.com in a new tab)
waterworld.com
- Water Bills Have Become a New Problem for American Households (opens Ecopolitic in a new tab)
Ecopolitic — is Ecopolitic biased? Our profile of this outlet
- Americans’ water bills are growing faster than groceries, overall inflation (opens Dailyfly in a new tab)
- Water Bills Have Been Charged 62% in This Country. Families with Low Incomes Are Barely Able to Cope. (opens Stirile Antena 1 Observator in a new tab)
Stirile Antena 1 Observator — is Stirile Antena 1 Observator biased? Our profile of this outlet
- Water Crisis in the US. Older Infrastructure and Laws on Pollution and Climate Change Cause Problems in Billing and Water Supply for Americans (opens economica.net in a new tab)
economica.net — is economica.net biased? Our profile of this outlet
- US Households Pay 62% More For Water Than They Did A Decade Ago (opens Technocracy News in a new tab)
Technocracy News — is Technocracy News biased? Our profile of this outlet
How did this read?
About the coverage, not about the story. We do not ask whether you agree with what happened — we have no honest use for that answer.